Table 1. Gross domestic product (GDP)
Table 2. Expenditure of the General Government Consolidated Budget (per cent)
Table 3. Monthly average gross wage per sections
Table 4. Population (at the beginning of the year )
Table 5. Natural increase per 1000 population
Table 6. Population of working age (at the beginning of the given year)
Table 7. Population forecast by age and gender till 2025 (Medium variant)
Table 9. Economic activity rate by gender and educational attainment, November, 2000, 2001, in %
Table 10. Employment structure by sections of economy (per cents of total)
Table 11. Registered unemployment and unemployment by Labour Force Survey
Table 13. Share of registered unemployed by educational attainment, %
Table 14: Education institutions: number and enrolment (1990 –2001)
Table 15: Selected educational indicators
Table 16: Teaching staff of vocational schools at the begining of academic year
Table 18:Discharged from secondary education
Table 20: Enrolment in education/training between 14 and 25
Table 21. The expenditures of special employment budget (millions LVL)
Table 22. The number of persons receiving unemployment benefit and average amount of it
Table 23. The mandatory contribution payment rates by the kind of state social insurance
Table 24. The unemployment benefits
Table 25: Annex 1 Conception of Education Development 2002—2005
ANNEXES
Table 1. Gross domestic product (GDP)
| Year | GDP, thousands LVL, (at average prices of 2000) | As per cent of previous year (at constant prices) | GDP, thousands LVL, at current prices | GDP per capita, converted in EUR (at current prices, using Purchasing Power Standards) |
| 1990 | 6,319,063 | 62,440 | ||
| 1991 | 5,523,163 | 143,325 | ||
| 1992 | 3,749,202 | 1,004,552 | ||
| 1993 | 3,321,340 | 1,467,014 | ||
| 1994 | 3,394,074 | 2,042,555 | ||
| 1995 | 3,361,988 | 2,329,418 | ||
| 1996 | 3,485,728 | 103.7 | 2,807,284 | |
| 1997 | 3,777,708 | 108.4 | 3,269,498 | 5230 |
| 1998 | 3,957,451 | 104.8 | 3,592,157 | 5620 |
| 1999 | 4,069,798 | 102.8 | 3,889,658 | 6070 |
| 2000 | 4,348,340 | 106.8 | 4,348,340 | 6990 |
| 2001 | 4,682,442 | 107.7 | 4,758,647 | 7710 |
Source: Statistical Yearbook of Latvia, 2002. – CSB. Riga, 2002.
Table 2. Expenditure of the General Government Consolidated Budget (per cent)
| 1998 | 1999 | 2000 | 2001 | |||||
| structure | Of GDP | structure | Of GDP | structure | Of GDP | structure | Of GDP | |
| Expenditure – total | 100 | 43.8 | 100 | 44.8 | 100 | 40.2 | 100 | 37.8 |
| General public services | 9.1 | 4.0 | 7.7 | 3.5 | 7.2 | 2.9 | 7.7 | 2.9 |
| Defence | 2.4 | 1.0 | 2.2 | 1.0 | 2.3 | 0.9 | 2.6 | 1.0 |
| Public order and safety, law enforcement | 5.8 | 2.6 | 6.7 | 3.0 | 6.4 | 2.6 | ||
| Education | 15.7 | 6.9 | 15.1 | 6.7 | 16.9 | 6.8 | 18.5 | 6.9 |
| Health care | 9.4 | 4.1 | 9.1 | 4.1 | 8.8 | 3.6 | 9.1 | 3.4 |
| Social security and welfare | 34.4 | 15.1 | 35.9 | 16.1 | 35.3 | 14.2 | 34.3 | 13.0 |
| Housing and community amenity, environmental protection | 5.5 | 2.4 | 4.5 | 2.0 | 5.3 | 2.1 | 5.9 | 2.2 |
| Recreation, sport, culture, religion | 2.8 | 1.2 | 2.9 | 1.3 | 3.4 | 1.4 | 3.5 | 1.3 |
| Agriculture, forestry, fishing | 4.6 | 2.0 | 4.7 | 2.1 | 3.9 | 1.6 | 3.7 | 1.4 |
| Transport, communications | 5.8 | 2.5 | 6.1 | 2.7 | 4.9 | 2.0 | 4.6 | 1.7 |
| Fuel and energy | 0.3 | 0.1 | 0.2 | 0.1 | 0.1 | 0.0 | 0.1 | 0.0 |
| Other economic affairs | 1.0 | 0.4 | 1.8 | 0.8 | 2.1 | 0.9 | 1.6 | 0.6 |
| Other activities not classified in major group | 3.1 | 1.4 | 3.0 | 1.4 | 3.1 | 1.3 | 2.3 | 0.9 |
Source: Economic Development of Latvia – Riga: Ministry of Economy, December 2001.
Economic Development of Latvia – Riga: Ministry of Economy, June, 2002.
Table 3. Monthly average gross wage per sections
| Year | 2000 | 2001 | ||||
| Total in LVL | 150 | 159 | ||||
| Percent of average wage | Public sector per cent of total average | Private sector per cent of total average | Percent of average wage | Public sector per cent of total average | Private sector per cent of total average | |
| Total | 100 | 113 | 91 | 100 | 113 | 92 |
| Agriculture, hunting, forestry (A) | 77 | 129 | 65 | 75 | 127 | 63 |
| Fishing (B) | 57 | 71 | 54 | 62 | 70 | 54 |
| Industry (C+D+E) | 101 | 150 | 95 | 100 | 139 | 95 |
| Construction (F) | 89 | 135 | 88 | 86 | 121 | 86 |
| Wholesale and retail trade; repair of motor vehicles, motorcycles and personal and household goods (G) | 72 | 99 | 72 | 74 | 102 | 74 |
| Hotels and restaurants (H) | 57 | 125 | 52 | 62 | 137 | 59 |
| Transport, storage, communication (I) | 129 | 143 | 108 | 126 | 137 | 111 |
| Financial intermediation (J) | 256 | 438 | 235 | 262 | 449 | 240 |
| Real estate, renting and business activities (K) | 114 | 112 | 115 | 116 | 109 | 120 |
| Public administration and defence (L) | 132 | 132 | 303 | 131 | 130 | 312 |
| Education (M) | 90 | 90 | 107 | 96 | 96 | 106 |
| Health and social work (N) | 83 | 84 | 75 | 83 | 84 | 75 |
| Other community, social and personal service activities (O) | 86 | 93 | 72 | 87 | 96 | 69 |
Source: Statistical Yearbook of Latvia, 2002. – CSB. Riga, 2002.
Table 4. Population (at the beginning of the year )
| Resident population | ||||
| total | urban | rural | inhabitants per 1 km2 of total area | |
| 1986 | 2,587,716 | 1,777,830 | 809,886 | 40.1 |
| 1990 | 2,668,140 | 1,842,317 | 825,823 | 41.3 |
| 1991 | 2,658,161 | 1,837,312 | 820,849 | 41.2 |
| 1992 | 2,643,000 | 1,822,135 | 820,865 | 40.9 |
| 1993 | 2,585,675 | 1,770,847 | 814,828 | 40.0 |
| 1994 | 2,540,904 | 1,750,777 | 790,127 | 39.3 |
| 1995 | 2,500,580 | 1,717,823 | 782,757 | 38.7 |
| 1996 | 2,469,531 | 1,693,507 | 776,024 | 38.2 |
| 1997 | 2,444,912 | 1,677,416 | 767,496 | 37.9 |
| 1998 | 2,420,789 | 1,660,070 | 760,719 | 37.5 |
| 1999 | 2,399,248 | 1,643,447 | 755,801 | 37.1 |
| 2000 | 2,381,715 | 1,621,758 | 759,957 | 36.9 |
| 2001 | 2,364,254 | 1,606,559 | 757,695 | 36.6 |
| 2002 | 2,345,768 | 1,591,986 | 753,782 | 36.3 |
Source: Demographic Yearbook of Latvia 2002 – Riga: CSB, 2002.
Table 5. Natural increase per 1000 population
| Year | Natural increase | Natural increase per 1000 population | |||||||
| total | Births | deaths | total | births | deaths | urban areas | rural areas | ||
| 1985 | 5,585 | 39,751 | 34,166 | 2.2 | 15.4 | 13.2 | |||
| 1990 | 3,106 | 37,918 | 34,812 | 1.1 | 14.2 | 13.1 | |||
| 1991 | -116 | 34,633 | 34,749 | -0.0 | 13.1 | 13.1 | |||
| 1992 | -3,851 | 31,569 | 35,420 | -1.5 | 12.1 | 13.6 | |||
| 1993 | -12,438 | 26,759 | 39,197 | -4.9 | 10.4 | 15.3 | |||
| 1994 | -17,501 | 24,256 | 41,757 | -7.0 | 9.6 | 16.6 | |||
| 1995 | -17,336 | 21,595 | 38,931 | -7.0 | 8.7 | 15.7 | -7.0 | -6.7 | |
| 1996 | -14,538 | 19,782 | 34,320 | -5.9 | 8.1 | 14.0 | -5.8 | -5.9 | |
| 1997 | -14,703 | 18,830 | 33,533 | -6.1 | 7.7 | 13.8 | -5.8 | -6.3 | |
| 1998 | -15,790 | 18,410 | 34,200 | -6.6 | 7.6 | 14.2 | -6.3 | -6.7 | |
| 1999 | -13,448 | 19,396 | 32,844 | -5.6 | 8.1 | 13.7 | -5.5 | -5.7 | |
| 2000 | -11,957 | 20,248 | 32,205 | -5.1 | 8.5 | 13.6 | -5.0 | -5.0 | |
| 2001 | -13,327 | 19,664 | 32,991 | -5.7 | 8.3 | 14.0 | -5.6 | -5.9 | |
Source: CSB data
Table 6. Population of working age (at the beginning of the given year)
| Year | Population under working age | Ratio to total population, % | Population of working age, (thousands) | Ratio to total population, % |
| 1986 | 585,341 | 22.6 | 1,477,086 | 57.1 |
| 1991 | 605,471 | 22.8 | 1,500,164 | 56.4 |
| 1992 | 603,318 | 22.8 | 1,475,149 | 55.8 |
| 1993 | 552,434 | 21.4 | 1,465,931 | 56.7 |
| 1994 | 536,331 | 21.1 | 1,435,691 | 56.5 |
| 1995 | 521,877 | 20.9 | 1,411,472 | 56.4 |
| 1996 | 505,896 | 20.5 | 1,413,597 | 57.2 |
| 1997 | 488,993 | 20.0 | 1,401,808 | 57.3 |
| 1998 | 469,672 | 19.4 | 1,391,700 | 57.5 |
| 1999 | 448,063 | 18.7 | 1,404,664 | 58.5 |
| 2000 | 428,082 | 18.0 | 1,402,249 | 58.9 |
| 2001 | 409,760 | 17.3 | 1,424,985 | 60.3 |
| 2002 | 390,478 | 16.6 | 1,425,116 | 60.8 |
Source: Demographic Yearbook of Latvia 2002 – Riga: CSB, 2002.
Table 7. Population forecast by age and gender till 2025 (Medium variant)
| Age groups | 0-14 | 15-19 | 20-24 | 25-34 | 35-44 | 45-54 | 55-59 | 60+ | Total | |
| 2005 | Total | 335,148 | 188,764 | 178,103 | 331,351 | 351,620 | 333,278 | 129,832 | 524,558 | 2,372,654 |
| Males | 170,563 | 95,856 | 90,015 | 168,152 | 176,193 | 156,926 | 57,715 | 188,219 | 1,103,639 | |
| Females | 164,585 | 92,908 | 88,088 | 163,199 | 175,427 | 176,352 | 72,117 | 336,339 | 1,269,015 | |
| 2010 | Total | 285,367 | 150,094 | 188,204 | 337,867 | 337,778 | 346,457 | 151,184 | 518,159 | 2,315,110 |
| Males | 144,084 | 76,532 | 95,245 | 169,987 | 171,447 | 166,017 | 68,280 | 189,616 | 1,081,208 | |
| Females | 141,283 | 73,562 | 92,959 | 167,880 | 166,331 | 180,440 | 82,904 | 328,543 | 1,233,902 | |
| 2020 | Total | 310,655 | 92,670 | 87,983 | 338,098 | 334,920 | 326,783 | 165,440 | 554,828 | 2,211,377 |
| Males | 157,019 | 46,358 | 44,189 | 170,847 | 167,297 | 163,052 | 77,888 | 214,537 | 1,041,187 | |
| Females | 153,636 | 46,312 | 43,794 | 167,251 | 167,623 | 163,731 | 87,552 | 340,291 | 1,170,190 | |
| 2025 | Total | 293,192 | 102,637 | 93,170 | 239,484 | 366,350 | 319,744 | 157,087 | 584,455 | 2,156,118 |
| Males | 148,401 | 51,475 | 46,489 | 120,749 | 183,157 | 158,185 | 76,449 | 231,997 | 1,016,903 | |
| Females | 144,792 | 51,162 | 46,680 | 118,736 | 183,193 | 161,560 | 80,636 | 352,458 | 1,139,216 |
Source: Prognosis of demographic development of Latvia: years 1998-2025. Informative material. Red. P. Zvidrins. Riga: University of Latvia, 1999
Table 8. Economically active population by structure of educational attainment (in thousands), November of year
| Economically active population by obtained education, thousands of population | |||||||
|
ISCED |
total in the country | males | females | ||||
| 2000 | 2001 | 2000 | 2001 | 2000 | 2001 | ||
| Higher | ISCED 5 | 223,0
|
220,2 | 96,0 | 88,8 | 127,0 | 131,4 |
| Secondary incl. secondary vocational | ISCED 3-4 | 705,4 | 689,9 | 359,0 | 360,1 | 346,4 | 329,7 |
| Basic | ISCED 2 | 182,3
|
180,6 | 117,1 | 114,3 | 65,2 | 66,3 |
| Incomplete basic | ISCED 1 | 21,2 | 14,2 | 11,1 | 6,7 | 10,1 | 7,5 |
Source: Labour Force Surveys: Main Indicators (November 2001) – Central Statistical Bureau of Latvia. Riga, March 2002.
Table 9. Economic activity rate by gender and educational attainment, November, 2000, 2001, in %
| Total in country | Males | Females | ||||
| 2000 | 2001* | 2000 | 2001* | 2000 | 2001* | |
| Higher | 77.7 | 77.9 | 79.2 | 80.4 | 76.6 | 76.3 |
| Secondary incl. secondary vocational | 68.6 | 67.1 | 77.0 | 76.1 | 61.6 | 59.4 |
| Basic | 36.0 | 36.7 | 46.4 | 47.2 | 25.6 | 26.5 |
| Incomplete basic | 12.5 | 9.3 | 18.0 | 12.4 | 9.3 | 7.5 |
Source: Labour force in Latvia. Labour force survey data, November 2000. A statistical bulletin. Central Statistical Bureau of Latvia. Riga, March 2001.
Labour Force Surveys: Main Indicators (November 2001) – Central Statistical Bureau of Latvia. Riga, March 2002.
* – data is not comparable with the previous years
Table 10. Employment structure by sections of economy (per cents of total)
| Sections of economy | 1996 | 1999 | 2000 | 2001* |
| 100 | 100 | 100 | 100 | |
| Agriculture, hunting, forestry | 17.3 | 14.9 | 13.3 | 14.8 |
| Fishing | 0.7 | 0.4 | 0.2 | 0.3 |
| Mining and quarrying | 0.2 | 0.1 | 0.2 | 0.1 |
| Manufacturing | 18.3 | 17.7 | 17.7 | 1.1 |
| Electricity, gas and water supply | 2.3 | 2.3 | 2.4 | 1.9 |
| Construction | 5.9 | 5.9 | 6.0 | 7.3 |
| Trade and repair | 12.5 | 15.3 | 16.0 | 16.9 |
| Hotels and restaurants | 1.6 | 2.2 | 2.4 | 2.0 |
| Transport, storage, communication | 8.9 | 8.6 | 8.5 | 8.0 |
| Financial intermediation | 1.4 | 1.1 | 1.4 | 1.5 |
| Real estate and business activities | 3.2 | 4.5 | 4.8 | 4.4 |
| Public administration and defence | 6.5 | 7.9 | 7.4 | 6.9 |
| Education | 9.9 | 9.1 | 9.3 | 9.3 |
| Health care and welfare | 5.7 | 5.2 | 5.1 | 5.3 |
| Other services | 5.6 | 4.8 | 5.3 | 5.0 |
Source: Labour force in Latvia. Labour force survey data, November 2000. A statistical bulletin. Central Statistical Bureau of Latvia. Riga, March 2001.
Labour force in Latvia. Labour force survey data, November 2001. A statistical bulletin. Central Statistical Bureau of Latvia. Riga, March 2002.
*- data is not comparable with the previous years
Table 11. Registered unemployment and unemployment by Labour Force Survey
| Year | Average rate of registered unemployment (%) | Rate of job seekers to the economically active population, in November of year (%) | ||
| Total | Males | Females | ||
| 1995 | 6.5 | 18.9 | 19.7 | 18.0 |
| 1996 | 7.0 | 18.3 | 18.9 | 17.7 |
| 1997 | 7.5 | 14.4 | 14.3 | 14.6 |
| 1998 | 7.6 | 13.8 | 13.5 | 14.1 |
| 1999 | 9.7 | 14.5 | 15.5 | 13.3 |
| 2000 | 8.5 | 14.6 | 15.6 | 13.5 |
| 2001 | 7.8 | 12.8 | 14.1 | 11.5 |
Source: CSB data and SES data
Table 12. Share of job seekers in the economically active population by sex, age, level of education, %
| 1996 | 2000 | 2001* | |||||||
| Total | Males | Females | Total | Males | Females | Total | Males | Females | |
| 15-24 | 29.0 | 28.1 | 30.3 | 23.6 | 21.5 | 26.4 | 20.8 | 20.3 | 21.3 |
| 25-34 | 18.7 | 17.5 | 20.1 | 13.7 | 14.9 | 12.1 | 13.1 | 14.9 | 11.1 |
| 35-44 | 15.9 | 17.7 | 14.2 | 14.2 | 14.6 | 13.9 | 11.6 | 12.9 | 10.3 |
| 45-54 | 14.9 | 16.0 | 14.0 | 14.2 | 17.9 | 11.1 | 12.7 | 14.2 | 11.4 |
| 55-64 | 17.2 | 18.6 | 14.9 | 10.1 | 11.1 | 8.7 | 9.8 | 11.0 | 8.5 |
| 65 + | 14.8 | 11.5 | 17.7 | 10.3 | 6.8 | 13.3 | 1.0 | 1.1 | 1.0 |
| Total | 18.3 | 18.9 | 17.7 | 14.6 | 15.6 | 13.5 | 12.8 | 14.1 | 11.5 |
| Of total jobseekers: | |||||||||
| Urban areas | 21.3 | 21.8 | 20.7 | 16.0 | 17.2 | 14.9 | 13.9 | 15.4 | 12.4 |
| Rural areas | 10.8 | 12.0 | 9.2 | 10.8 | 11.9 | 9.6 | 10.4 | 11.5 | 9.1 |
| Of total jobseekers with education: | |||||||||
| higher | 9.0 | 7.7 | 10.0 | 5.4 | 5.7 | 5.2 | 5.3 | 4.5 | 5.9 |
| Secondary incl. secondary vocational | 18.7 | 18.7 | 18.7 | 15.1 | 15.1 | 15.1 | 13.8 | 14.4 | 13.1 |
| Basic | 25.7 | 26.2 | 24.9 | 22.3 | 24.6 | 18.2 | 17.9 | 20.0 | 14.4 |
| Incomplete basic | 22.5 | 27.6 | 13.9 | 27.2 | 25.1 | 29.5 | 19.1 | 27.1 | 12.1 |
Source: Labour force in Latvia. Labour force survey data, November 2000. A statistical bulletin. Central Statistical Bureau of Latvia. Riga, March 2001.
Labour force in Latvia. Labour force survey data, November 2001. A statistical bulletin. Central Statistical Bureau of Latvia. Riga, March 2002.
* – data is not comparable with the previous years
Table 13. Share of registered unemployed by educational attainment, %
| 1995 | 1998 | 1999 | 2000 | 2001 | |
| Total | 100 | 100 | 100 | 100 | 100 |
| Of which: | |||||
| Higher | 7.1 | 6.8 | 6.9 | 5.9 | 7,1 |
| Vocational and secondary vocational | 39.1 | 38.0 | 40.6 | 33.4 | 41.8 |
| General secondary | 30.9 | 31.3 | 29.6 | 34.1 | 27.8 |
| Basic, incomplete basic | 22.9 | 23.9 | 22.9 | 26.6 | 23.3 |
Source: SES data;
Statistical Yearbook of Latvia, 2002. – CSB. Riga, 2002.
Table 14: Education institutions: number and enrolment (1990 –2001)
| 1990 | 1995 | 1999 | 2000 | 2001 | 2002 | ||
| Pre-school establishments | Number of institutions | 1123
|
608
|
573
|
561
|
552 | 551 |
| Enrolment | 111,471 | 68,490 | 65,097 | 61,759
|
61,451
|
69,194 | |
| General schools | Number of institutions | 962
|
1094
|
1095
|
1074
|
1066 | 1052 |
| Enrolment | 352,450 | 347,541 | 361,432 | 359,818
|
351,989 | 340,308 | |
| VET schools | Number of institutions | 143
|
133
|
121
|
120 | 126 | 124 |
| Enrolment | 67,409 | 42,374 | 47,703 | 48,625 | 47,627 | 46,533 | |
| Institutions of higher education | Number of institutions
|
10
|
28
|
33
|
33 | 36 | 37 |
| Enrolment | 45,953 | 46,696 | 89,509 | 101,270 | 110,500 | 118,944 | |
Source: Education Institutions in Latvia at the beginning of the school year 2001/2002./Statistical Bulletin – Riga: CSB, 2002
Education Institutions in Latvia at the beginning of the school year 2002/2003./Statistical Bulletin – Riga: CSB, 2003
Table 15: Selected educational indicators
|
School year 2001/2002 |
School year 2002/2003
|
|||||
| Number of schools | Average number of students per school | Ratio of teachers to students | Number of schools | Average number of students per school | Ratio of teachers to students | |
| General schools | 1029 | 330 | 1: 10.4 | 1017 | 323 | 1:10.0 |
| VET schools (average) | 126 | 378 | 1:8.5 | 124 | 375 | 1:8.2 |
| VET schools by governing authority: | ||||||
| Ministry of Education and Science | 49 | 545 | 1:11.7 | 47 | 588 | 1:13.1
|
| Ministry of Agriculture | 36 | 365 | 1:8.8 | 35 | 374 | 1:9.0 |
| Ministry of Welfare | 8 | 302 | 1:4.9 | 8 | 294 | 1:4.1 |
| Municipal | 7 | 203 | 1:7.6 | 7 | 210 | 1:8.2 |
| Ministry of Culture | 15 | 132 | 1:2.3
|
15 | 127 | 1:1.9 |
| Private | 12 | 136 | 1:7.7 | 9 | 176 | 1:8.4 |
| Ministry of Interior | 3 | 108 | 1:6.2 | 3 | 95 | 1:3.7 |
Source: Education institutions in Latvia at the beginning of school year 2000/2001. Statistical bulletin – Central Statistical Bureau of Latvia. Riga, 2001.
Education institutions in Latvia at the beginning of school year 2001/2002. Statistical bulletin – Central Statistical Bureau of Latvia. Riga, 2002.
Education institutions in Latvia at the beginning of the school year 2002/2003. Statistical bulletin – Central Statistical Bureau of Latvia. Riga, 2003.
Table 16: Teaching staff of vocational schools at the begining of academic year
| 2000/01 | 2002/2003 | |||||||
Total |
VET schools | Total | VET schools | |||||
| State | Municipal | Private | State | Municipal | Private | |||
| Total | 5439 | 5139 | 169 | 131 | 5693 | 5325 | 179 | 189 |
| Age: | ||||||||
| 30 and younger | 870 | 795 | 337 | 38 | 823 | 759 | 29 | 35 |
| 31-39 | 1118 | 1039 | 338 | 41 | 1065 | 970 | 50 | 45 |
| 40-49 | 1682 | 1561 | 66 | 55 | 1661 | 1563 | 56 | 42 |
| 50-59 | 1255 | 1172 | 34 | 49 | 1397 | 1325 | 29 | 43 |
| 60 and elder | 657 | 619 | 11 | 27 | 747 | 708 | 15 | 24 |
| Education: | ||||||||
| With secondary
of which with pedagogical |
1213 | 1109 | 62 | 42 | 1110 | 1028 | 54 | 28 |
|
292 |
286 |
4 |
2 |
337 |
325 |
11 |
1 |
|
| With higher
of which with higher pedagogical |
4365 | 4073 | 124 | 168 | 4580 | 4294 | 125 | 161 |
|
3237 |
3028 |
92 |
117 |
3501 |
3273 |
97 |
131 |
|
| Total staff with pedagogical education | 3529
or 64.9% |
3314
or 64.5% |
96
or 56.8% |
119
or 90.8% |
3838
or 67.4% |
3598
or 67.6% |
108
or 60.1% |
132
or 69.8% |
MoES data
Table 17: Number of pupils learning foreign languages in general and VET schools in 2002/2003 academic year
| General schools | VET schools | ||||
| Total | Of which: | ||||
| Grades 1-4 | Grades 5-9 | Grades 10-12 | |||
| Total | 340308 | 103359 | 174606 | 62343 | 46533 |
| Of which:
No foreign language |
49910 |
43526 |
4711 |
1673 |
|
| One foreign language | 144013 | 58690 | 70249 | 15074 | 40253 |
| Two foreign languages | 137729 | 1132 | 97874 | 38723 | 15107 |
| Three foreign languages | 8516 | 11 | 1757 | 6748 | |
| Four foreign languages | 140 | – | 15 | 125 | |
Source: Education institutions in Latvia at the beginning of the school year 2002/2003. Statistical bulletin – Central Statistical Bureau of Latvia. Riga, 2003.
Table 18:Discharged from secondary education
| Number of dropouts | Percentage of total number of students | ISCED level | |||
| 2000/2001 | 2001/02 | 2000/2001 | 2001/02 | ||
| General schools (grades 10 –12) | 1932 | 2003 | 3.8 | 4.1 | ISCED 3 |
| VET schools | 7001 | 6862 | 14.4 | 14.4 | ISCED 2- 3 -4 |
Education institutions in Latvia at the beginning of school year 2000/2001. Statistical bulletin – Central Statistical Bureau of Latvia. Riga, 2001.
Education institutions in Latvia at the beginning of school year 2001/2002. Statistical bulletin – Central Statistical Bureau of Latvia. Riga, 2002.
Table 19: Proportion of inhabitants in a certain age group who acquire a certain level of education versus the total number of that age group (1999/2000 – 2002/2003)
| Age groups | 1999/2000 | 2000/2001 | 2001/2002 | 2002/2003* | |
| Second stage of basic education (ISCED – 2) | 11 – 15 | 80.6 | 85.5 | 88.7 | 88.6 |
| Secondary education (ISCED – 3) | 16 – 18 | 70.3 | 71.1 | 70.6 | 70.8 |
| First stage of tertiary education
(ISCED – 5) |
19 – 23 | 26.4 | 29.3 | 31.6 | 34.0 |
Source: Education institutions in Latvia at the beginning of school year 1999/2000. Statistical bulletin – Central Statistical Bureau of Latvia. Riga, 2000
Education institutions in Latvia at the beginning of school year 2000/2001. Statistical bulletin – Central Statistical Bureau of Latvia. Riga, 2001.
Education institutions in Latvia at the beginning of school year 2001/2002. Statistical bulletin – Central Statistical Bureau of Latvia. Riga, 2002.
Education institutions in Latvia at the beginning of the school year 2002/2003. Statistical bulletin – Central Statistical Bureau of Latvia. Riga, 2003.
* – Provisional data of the population are used
Table 20: Enrolment in education/training between 14 and 25
| Age | General schools | VET schools | Institutions of higher education | |||
| 2001/02 | 2002/03 | 2001/02 | 2002/03 | 2001/02 | 2002/03 | |
| 14 years | 36868 | 35877 | 89* | 70* | ||
| 15 years | 35634 | 35641 | 1641 | 944 | ||
| 16 years | 26216 | 27860 | 9158 | 8619 | ||
| 17 years | 22517 | 22743 | 11260 | 10932 | 188* | 310* |
| 18 years | 10034 | 10926 | 10345 | 10411 | 8290 | 7874 |
| 19 years | 3229 | 3582 | 6545 | 6953 | 11740 | 13160 |
| 20 years | 1411 | 1389 | 3042 | 3211 | 11909 | 12887 |
| 21 years | 1031 | 989 | 1492 | 1529 | 11178 | 11766 |
| 22 years | 3324** | 3492** | 843 | 876 | 9187 | 9922 |
| 23 years | 3212** | 2988** | 7393 | 7872 | ||
| 24 years | 5720 | 5854 | ||||
*the given age and younger
** the given age and older
Source: Education institutions in Latvia at the beginning of school year 2001/2002. Statistical bulletin – Central Statistical Bureau of Latvia. Riga, 2002.
Education Institutions in Latvia at the beginning of the school year 2002/2003./Statistical Bulletin – Riga: CSB, 2003
Table 21. The expenditures of special employment budget (millions LVL)
| 1998 | 1999 | 2000 | 2001 | |
| Unemployment benefits | 14.7 | 27.5 | 21.5 | 18.4 |
| Stipends for unemployed | 0.7 | 0.8 | 0.6 | 0.8 |
| Other employment measures | 4.4 | 5.3 | 4.6 | 4.5 |
| Payments for pensions insurance | 2.4 | 5.2 | 4.6 | 4.7 |
| Administrative costs | 0.6 | 0.5 | 0.5 | 0.5 |
| Other expenditures | 3 | 3.6 | 0 | 0.03 |
Source: Social insurance in Latvia / Figures and facts 2001 – Riga: SSIA, 2002.
Table 22. The number of persons receiving unemployment benefit and average amount of it
| Year | Persons receiving unemployment benefit | Average amount of unemployment benefit (LVL) |
| 1999 | 572,886 | 48.07 |
| 2000 | 477,414 | 43.30 |
| 2001 | 454,923 | 40.55 |
Source: Social insurance in Latvia / Figures and facts 2001 – Riga: SSIA, 2002.
Table 23. The mandatory contribution payment rates by the kind of state social insurance[1]
| 1999 | 2000 | 2001 | 2002 | 2003 | |
| Insurance for state pensions | 27.91% | 27.10% | 26.93% | 27.10% | 25.59% |
| Insurance for the case of unemployment | 2.34% | 2.45% | 2.20% | 1.90% | 1.94% |
| Insurance against accidents at work | 0.09% | 0.09% | 0.09% | 0.09% | 0.09% |
| Disability insurance | 4.67% | 4.16% | 3.89% | 3.76% | 3.31% |
| Maternity and sickness insurance | 2.08% | 2.29% | 1.98% | 2.24% | 2.16% |
| Total rate of social contribution payment | 37.09% | 36.09% | 35.09% | 35.09% | 33.09% |
Source: Cabinet of Ministers Regulations on Mandatory contribution payment rates by the kind of state social insurance
Table 24. The unemployment benefits
The Law “On Insurance in the Case of Unemployment” prescribes that the amount of the unemployment benefit is calculated in proportion to the length of the insurance period and according to incomes from which contribution payments are made for the case of unemployment:
1) from 1 to 9 years – 50 % of the average insurance contribution payment salary;
2) from 10 to 19 years – 55 % of the average insurance contribution payment salary;
3) from 20 to 29 years – 60 % of the average insurance contribution payment salary;
4) more than 30 years – 65 % of the average insurance contribution payment salary.
The above unemployment benefit is paid depending on the length of the unemployment period:
during the first three months it is paid in full
from three to six months – 75 % of the established unemployment benefit
from six to nine months – 50% of the established unemployment benefit
As of November 2002 there are no any restrictions on the amount of the unemployment benefit
The registered unemployed has rights to receive unemployment benefit if social insurance contributions are paid at least 9 months within last 12 months. The unemployment benefit could be received 9 months during the period of 12 months after it is granted.
Table 25: Annex 1 Conception of Education Development 2002—2005
Correlation of the goals of the Concepts of Education Development and the directions of action
NON PROFIT ORGANIZATION STATE JOINT STOCK COMPANY
STATE EMPLOYMENT SERVICE
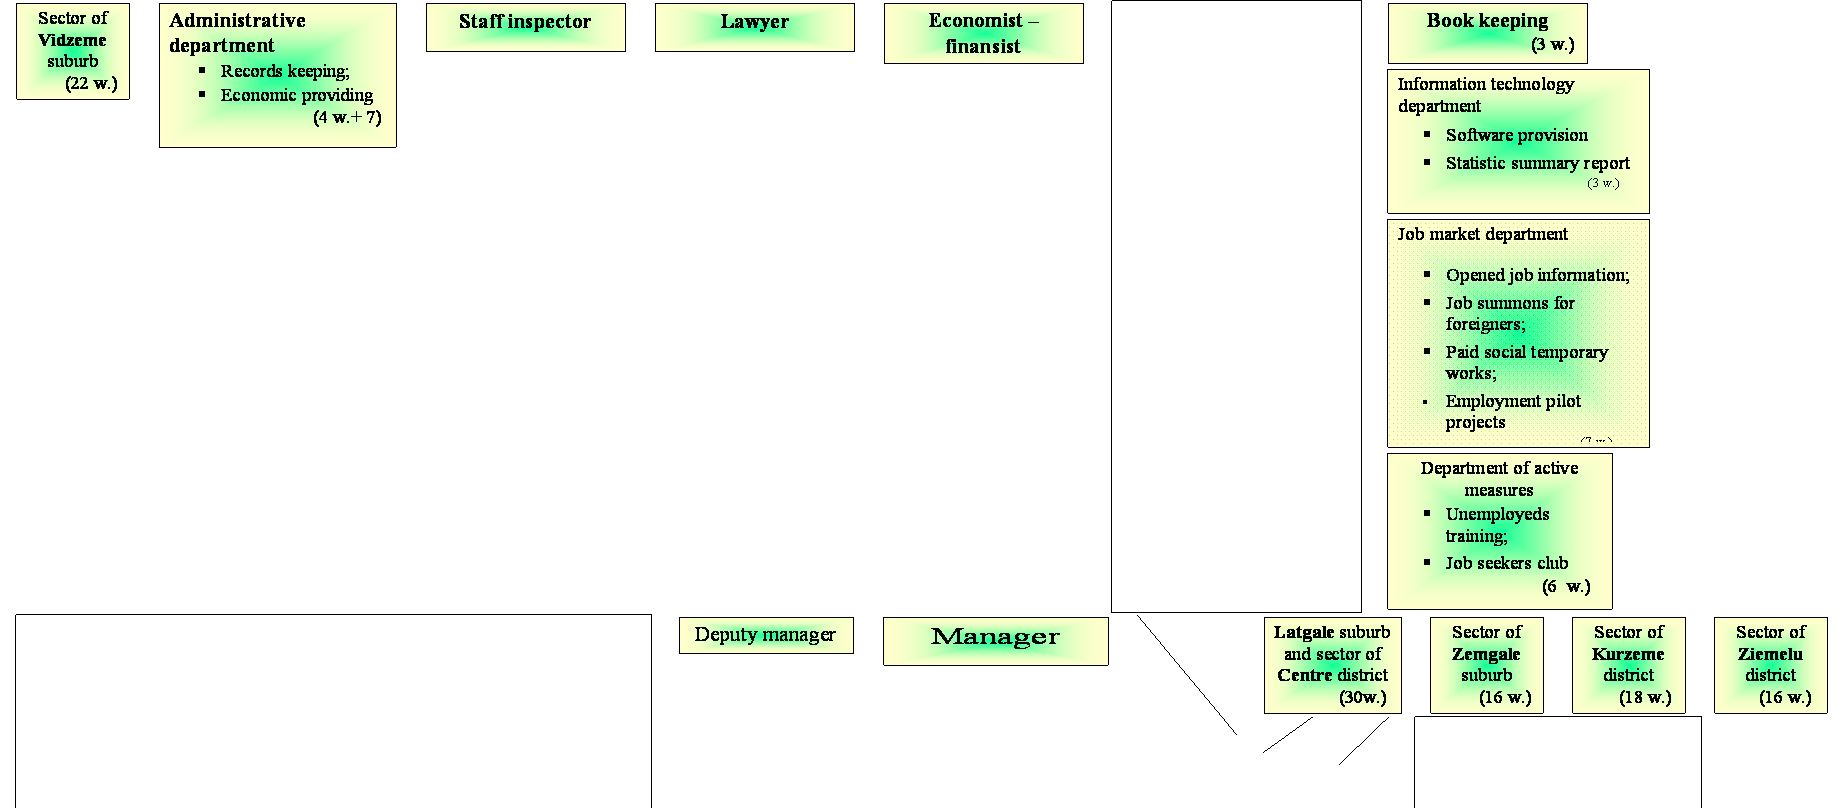
Employment State Service – Riga Centre
On 31.12.2002.
[1] During 1999 – 2003 the rate of contribution payment remained unchanged for employees and was 9%. The rate of contribution payment for employers reduced from 28.09% to 24.09%.